How many Canadians are affected by household food insecurity?
Based on the latest data from Statistics Canada’s Canadian Income Survey, 10 million Canadians, including 2.5 million children, in the ten provinces lived in food-insecure households in 2024. This page provides an overview of food insecurity monitoring in Canada and the latest statistics.
Notice
Statistics Canada recently released new data on food insecurity in 2023 from the Canadian Income Survey. In 2024, 10 million people in the ten provinces, including 2.5 million children, lived in a food-insecure household. See the new update here.
This page summarizes the household-level statistics from 2022, available from PROOF’s annual reporting.
Household food insecurity refers to when a household has inadequate or insecure access to food due to financial constraints. Statistics Canada monitors food insecurity through large, population-representative surveys.
Statistics Canada measures food insecurity using the Household Food Security Survey Module (HFSSM), which consists of 18 questions about experiences of food deprivation over the past 12 months. These experiences range in severity from worrying about running out of food to going whole days without eating, all due to financial constraints.
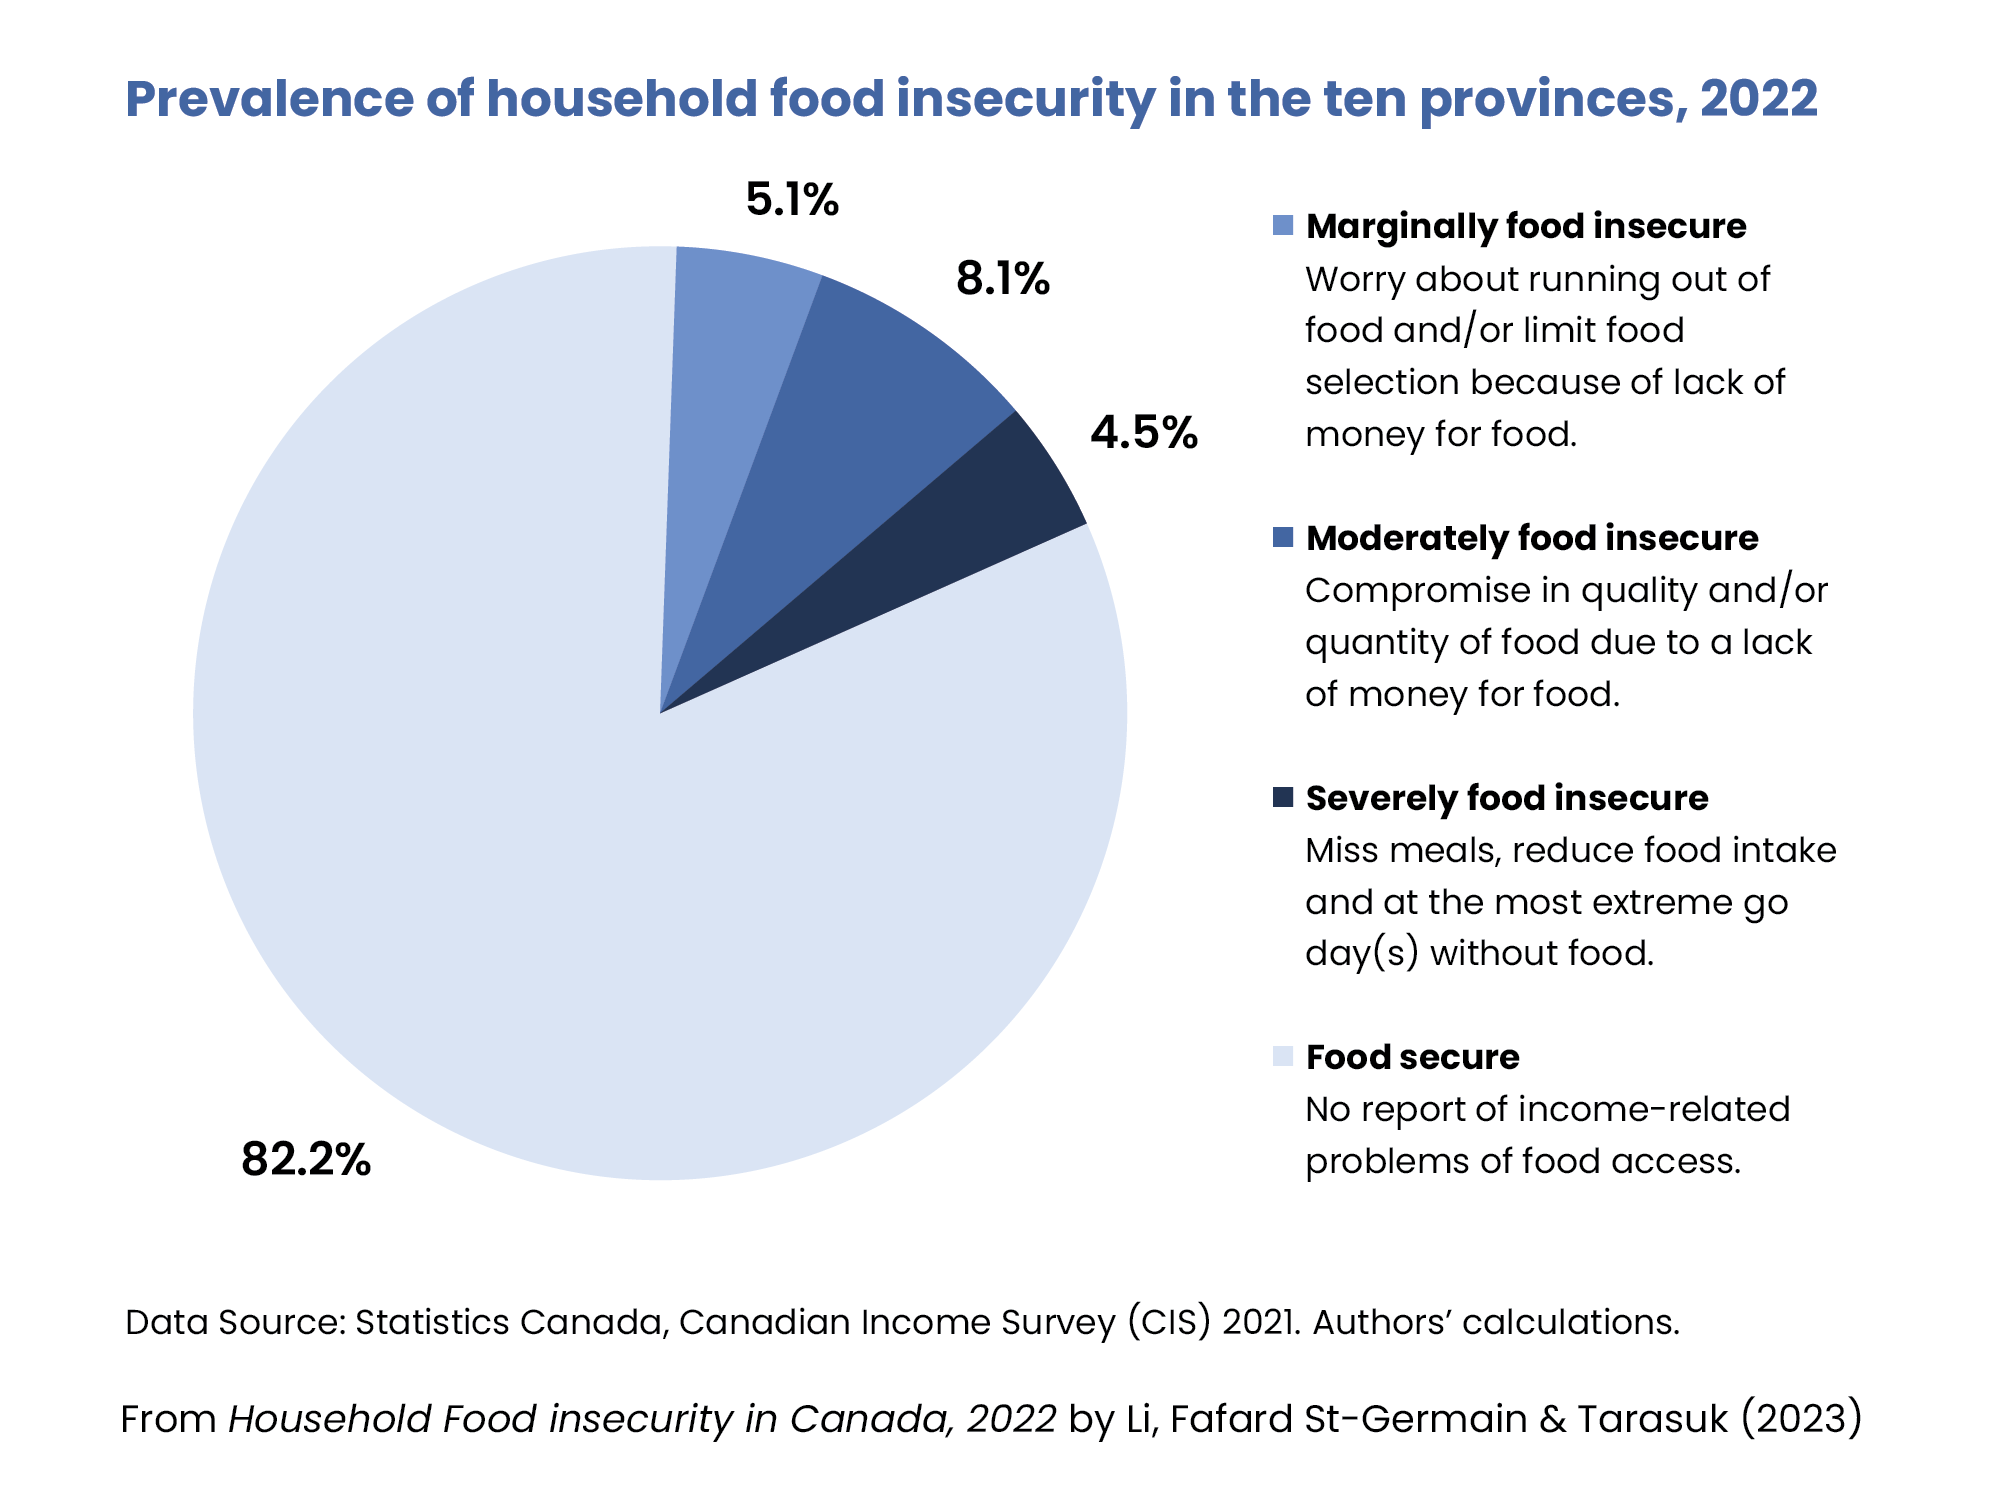
Based on a household’s experience, they can be considered food secure or in one of 3 categories of food insecurity:
Marginal food insecurity: Worry about running out of food and/or limited food selection due to a lack of money for food.
Moderate food insecurity: Compromise in quality and/or quantity of food due to a lack of money for food.
Severe food insecurity: Miss meals, reduce food intake, and at the most extreme go day(s) without food.
Based on the data from Statistics Canada’s Canadian Income Survey (CIS), 17.8% of households in the ten provinces were food-insecure in 2022.[1] This amounted to 6.9 million Canadians, including almost 1.8 million children under the age of 18, living in households that experienced some level of food insecurity.
These numbers are an underestimate because the survey sample does not include people living on First Nations reserves, people in some remote northern areas, or unhoused people – i.e., three groups at high risk of food insecurity. In 2022, 33.4% of off-reserve Indigenous Peoples in the ten provinces lived in food-insecure households. Other studies have also documented high vulnerability among on-reserve communities.[1]
Food insecurity across the provinces
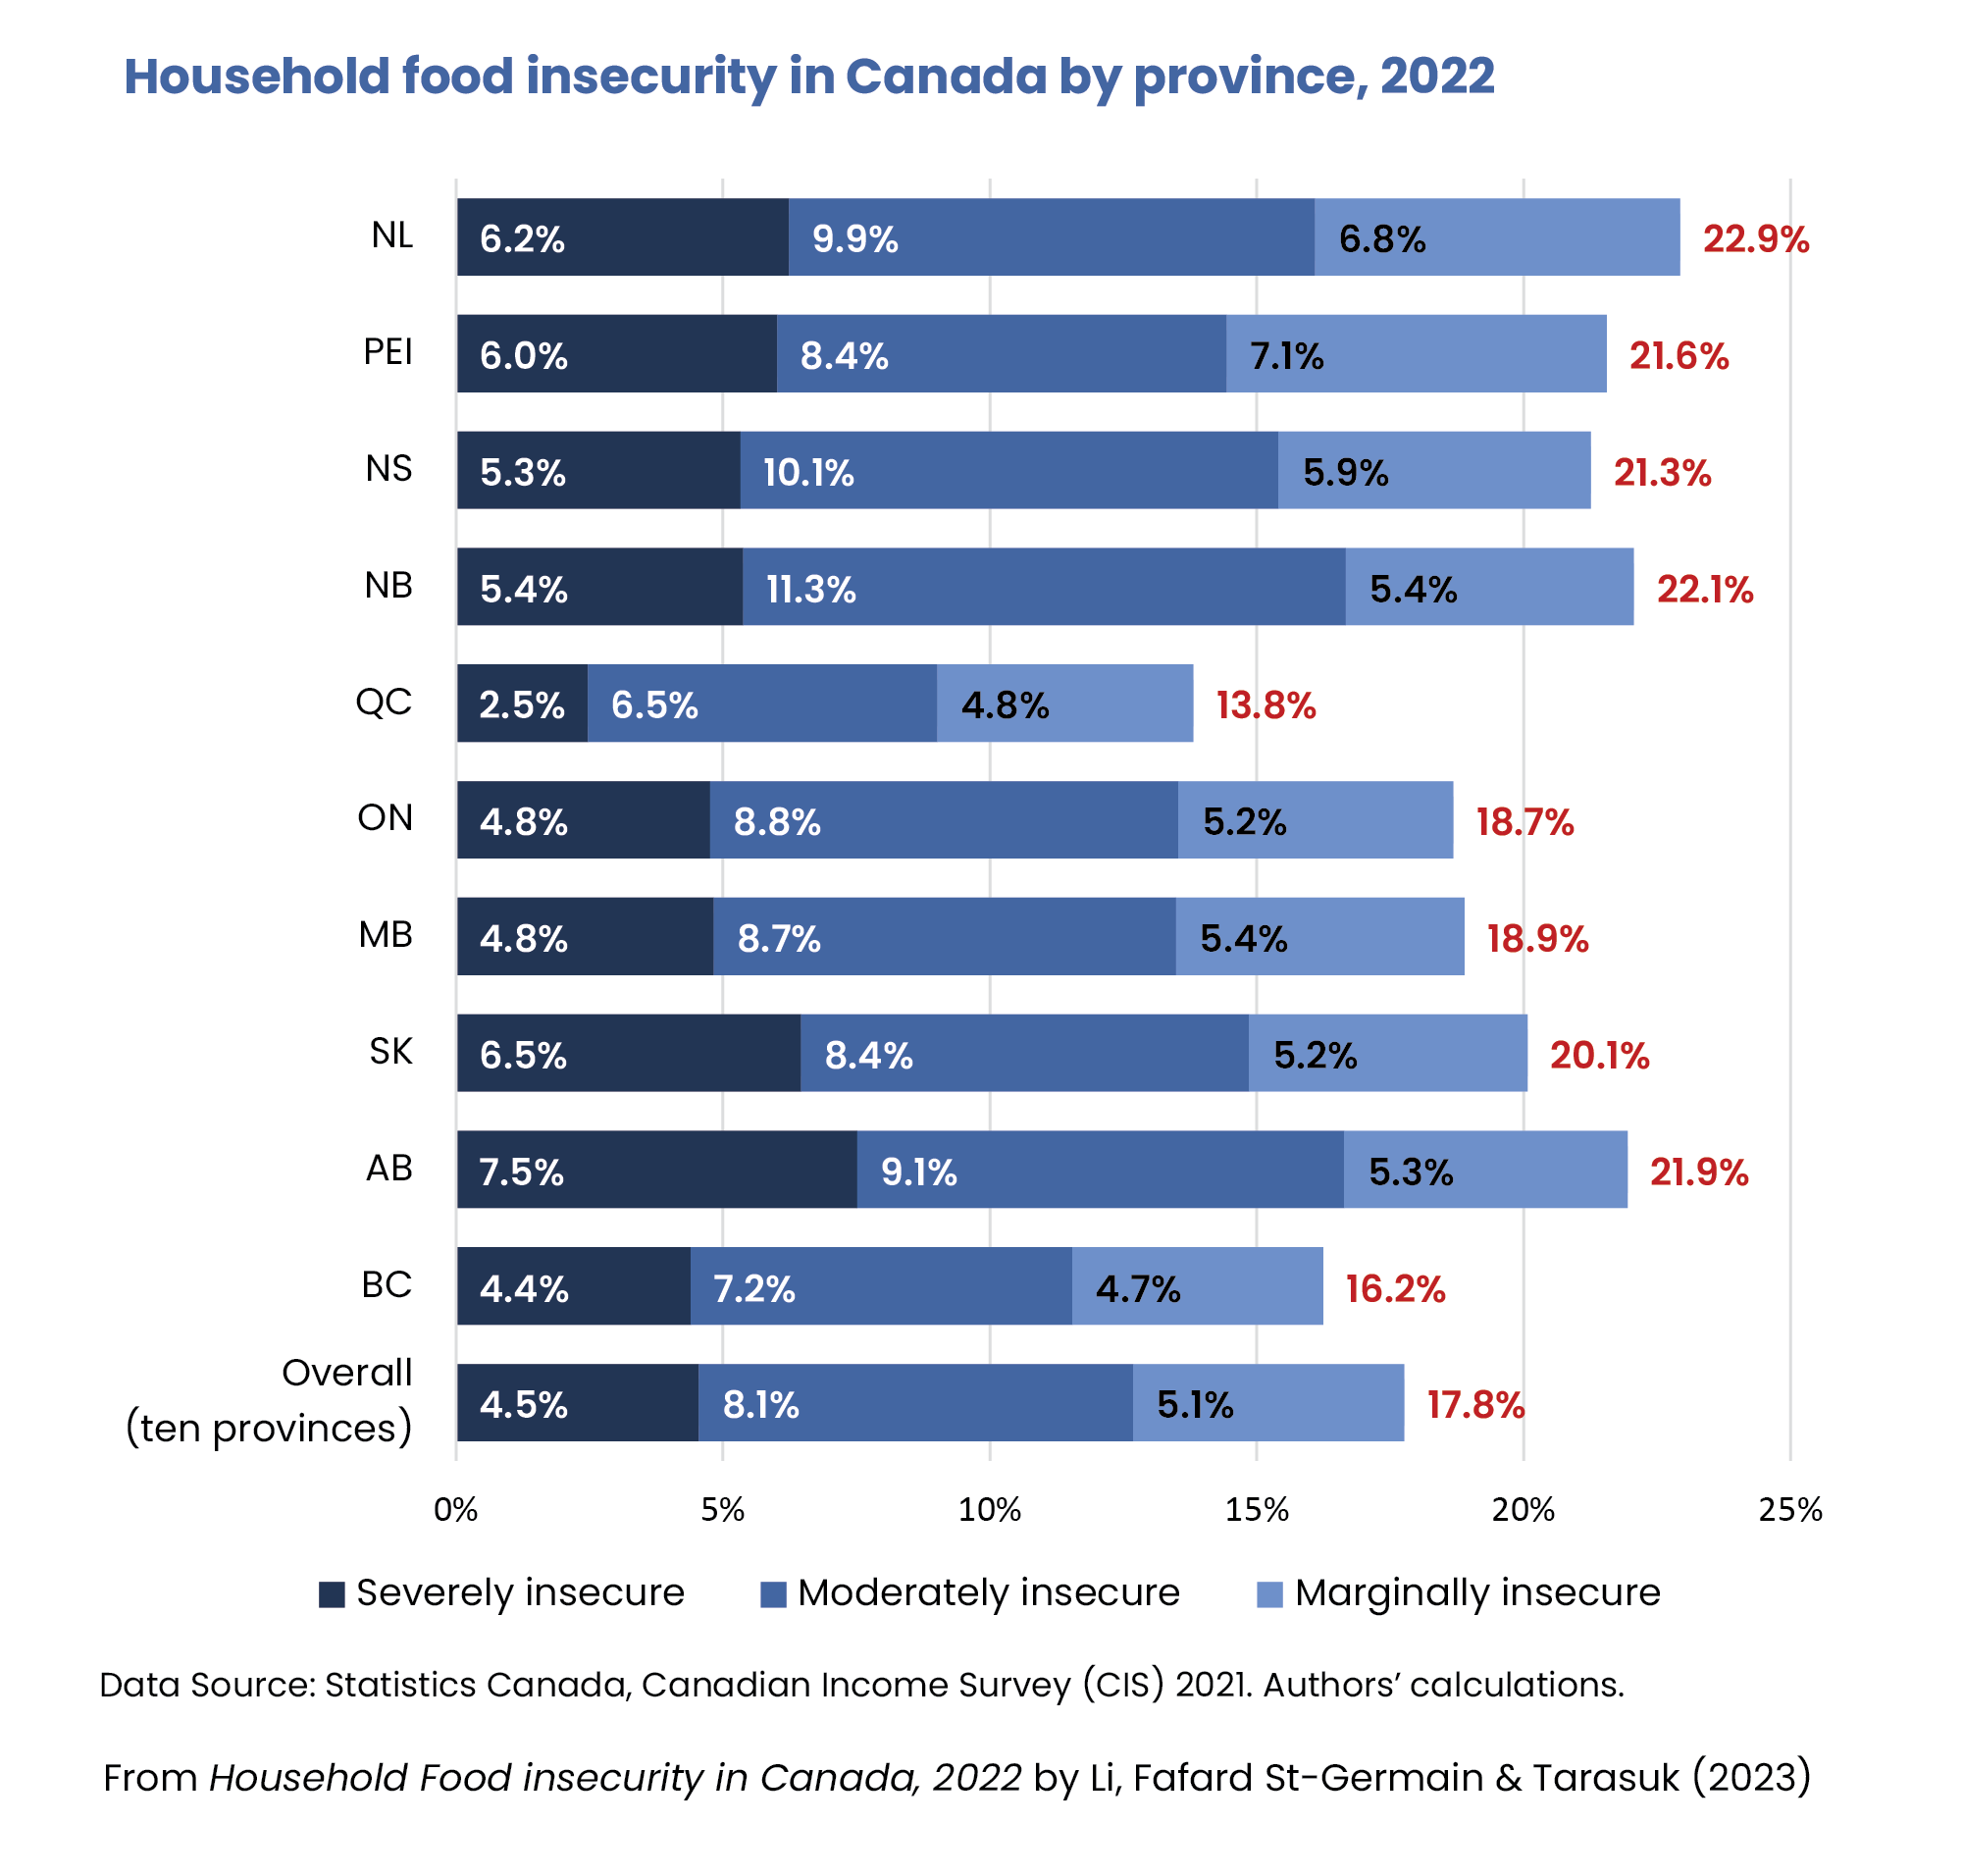
Newfoundland and Labrador had the highest rate of food insecurity in 2022 at 22.9%.[1] The next highest prevalence estimates were found in New Brunswick (22.1%) and Alberta (21.9%). Quebec had the lowest prevalence of household food insecurity at 13.8%.
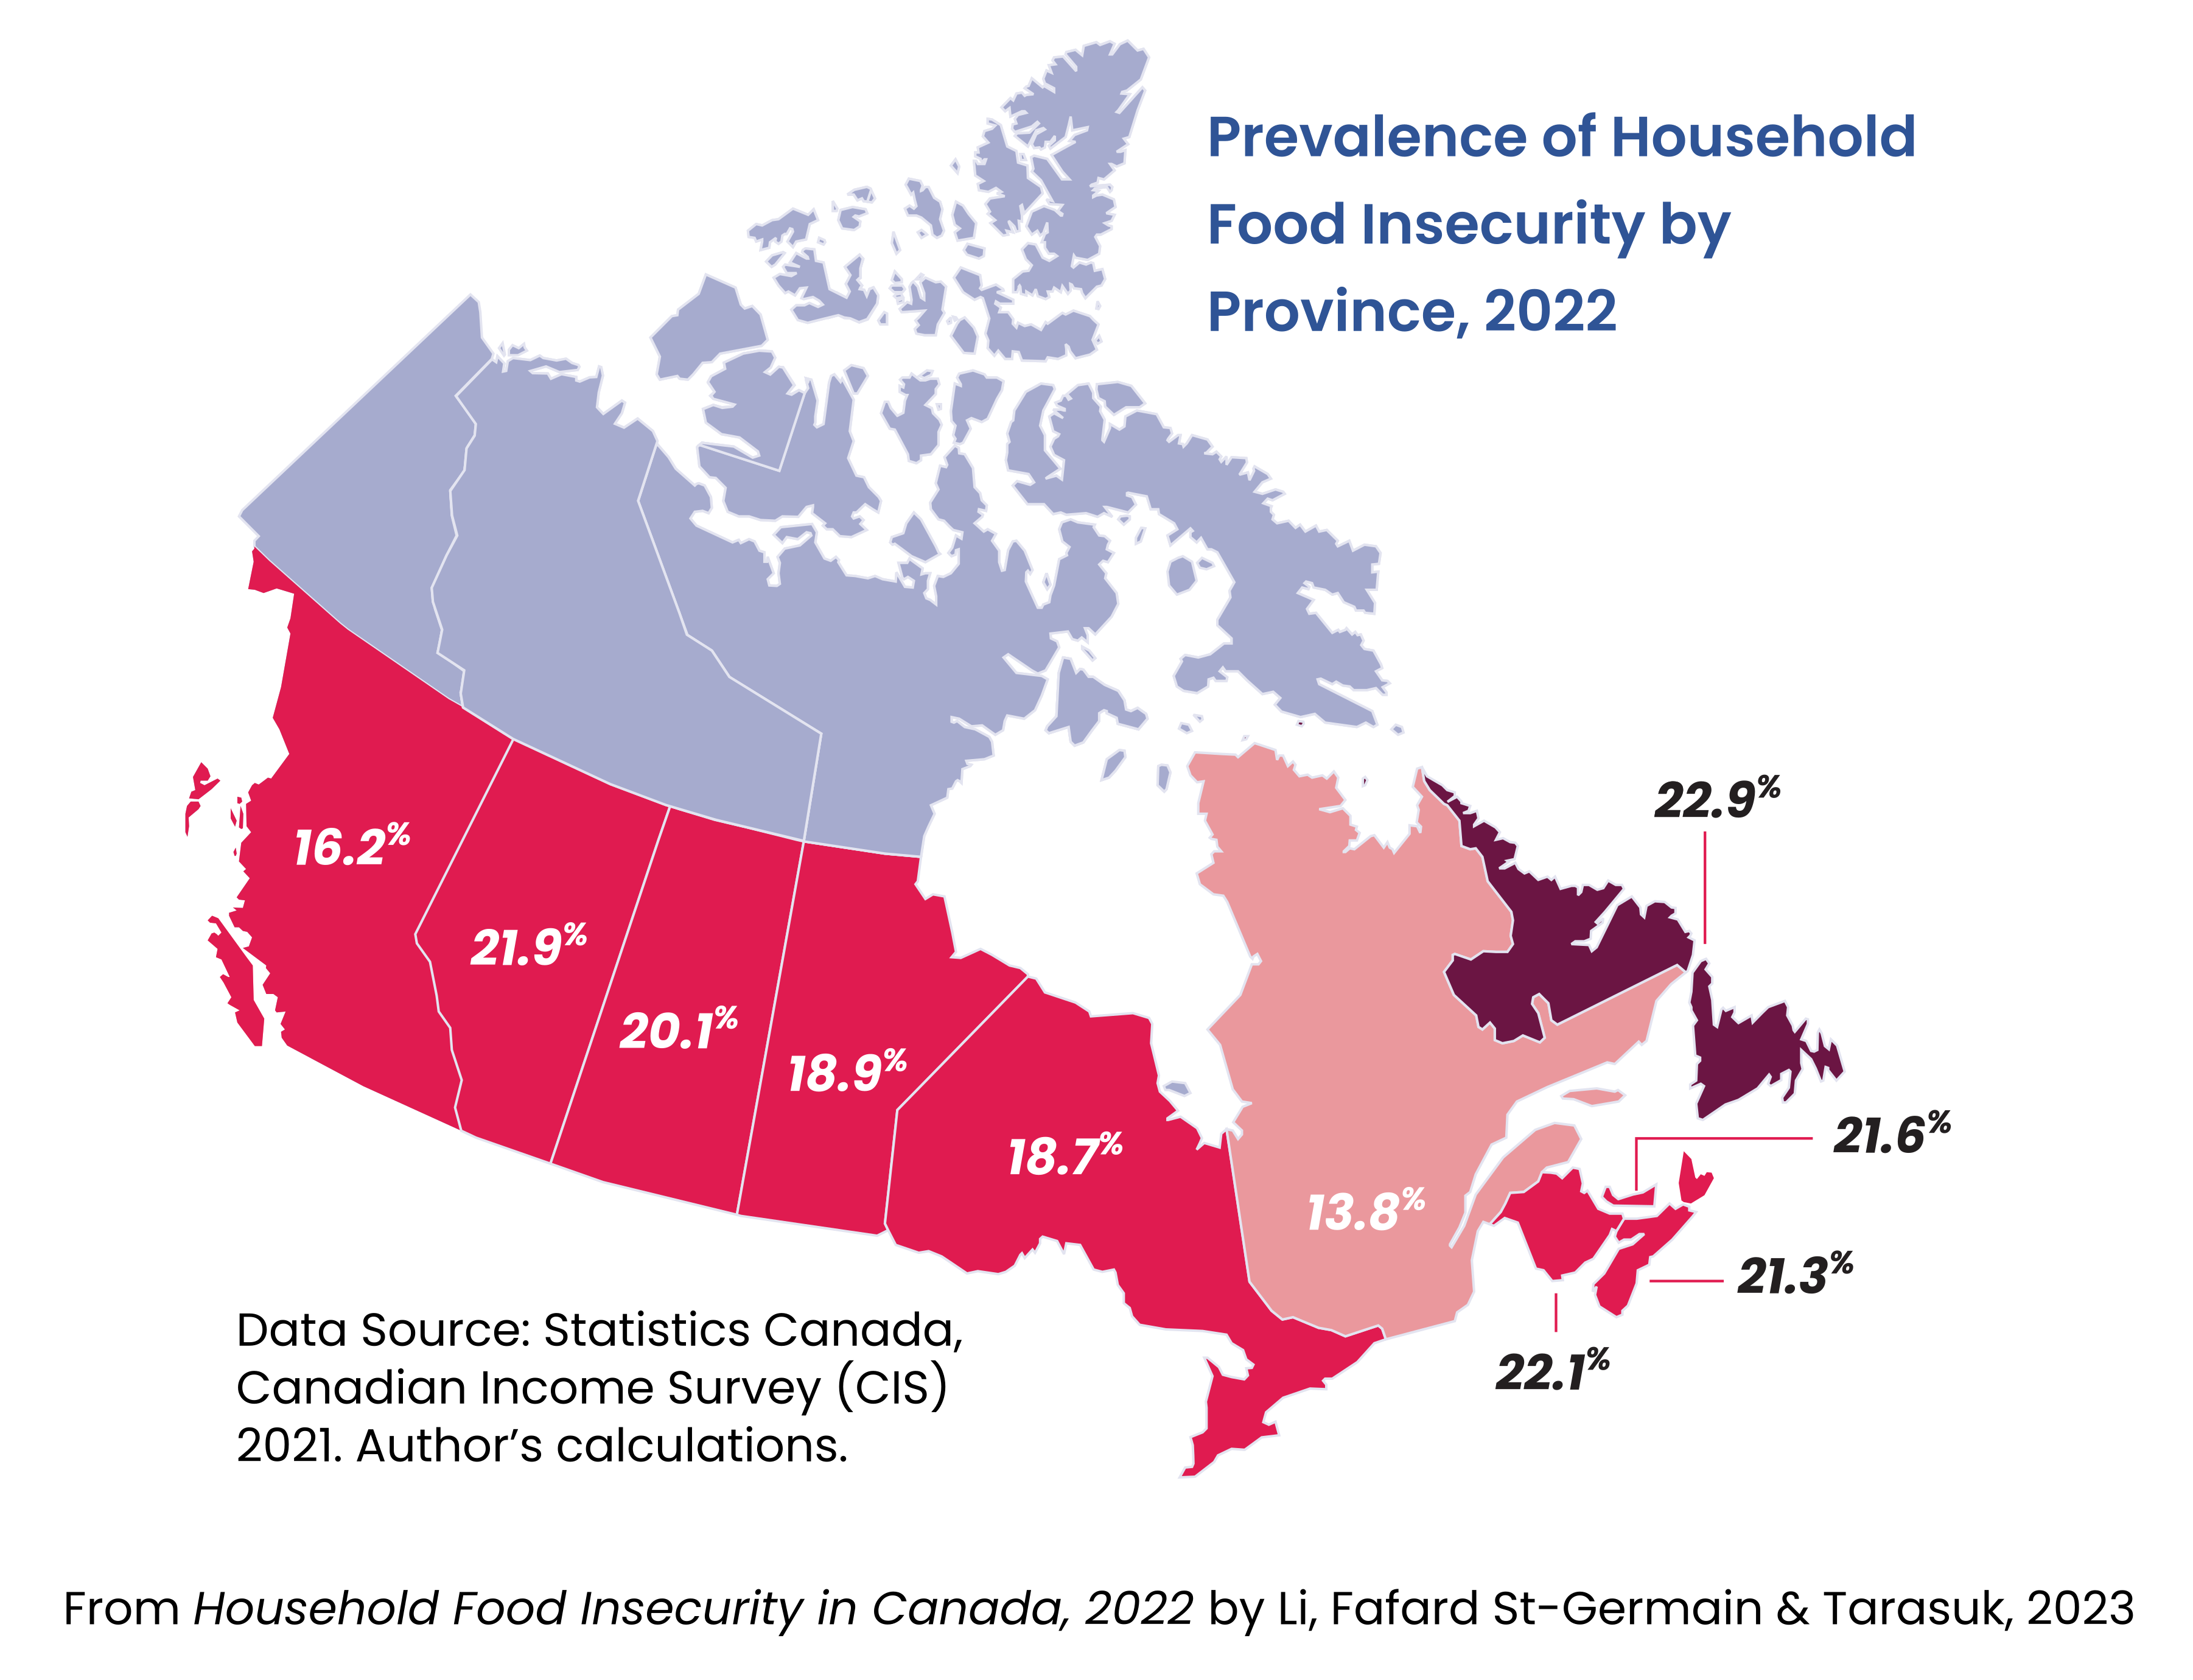
Of particular concern is the high prevalence of severe food insecurity in several provinces, including Alberta (7.5%), Saskatchewan (6.5%), Newfoundland and Labrador (6.2%) and Prince Edward Island (6.0%).[1] Severe food insecurity was lowest in Quebec (2.5%).
Food insecurity in the territories
Food insecurity in the territories, especially Nunavut, has always been extraordinarily high. In 2022, 46.1% of people in Nunavut, 22.2% of people in Northwest Territories, and 12.8% of people in Yukon lived in food-insecure households in 2022. [2]
Due to unique challenges for data collection and small sample sizes in the North, caution needs to be taken when interpreting these prevalence estimates or comparing them with other statistics. The territorial estimates also cannot be compared to the provincial estimates elsewhere on this page and in our reports because they describe the percentage of people affected, not households.
Given the challenges of monitoring food insecurity in the territories in recent years, more comprehensive surveying is needed.
What does this measurement tell us?
While these questions ask about the ability to afford food, the answers tell us something deeper about a household’s material circumstances.
The deprivation experienced by food-insecure households is not limited to food. By the time a household appears in these statistics, they are having trouble meeting other basic expenses. Food-insecure households compromise spending on other necessities, including housing and prescription medications.[3][4][5]
Food insecurity reflects a household’s inability to meet basic needs because of a lack of financial resources. By identifying whether households have difficulty affording food, we learn more about their economic wellbeing and hardship, making this measurement an important indicator of poverty for policy makers to attend to.
A brief history of household food insecurity monitoring in Canada
Statistics Canada has been systematically monitoring household food insecurity through the Canadian Community Health Survey (CCHS) since 2005. In 2019, the HFSSM was added to the Canadian Income Survey (CIS) after the federal government identified food insecurity as a key indicator for its poverty reduction strategy.[6]
Consistent monitoring was not achieved through CCHS because jurisdictions could opt out of measuring food insecurity in some years, but CIS now ensures reliable, annual evaluations. Given the methodological differences, it is not appropriate to directly compare and interpret differences between numbers from the two surveys. Since CIS has a higher response rate than CCHS, we believe that it may provide more representative estimates for food insecurity.
For more information, see the section “How is Food Insecurity Measured in Canada?” in our report, Household Food Insecurity in Canada, 2022.
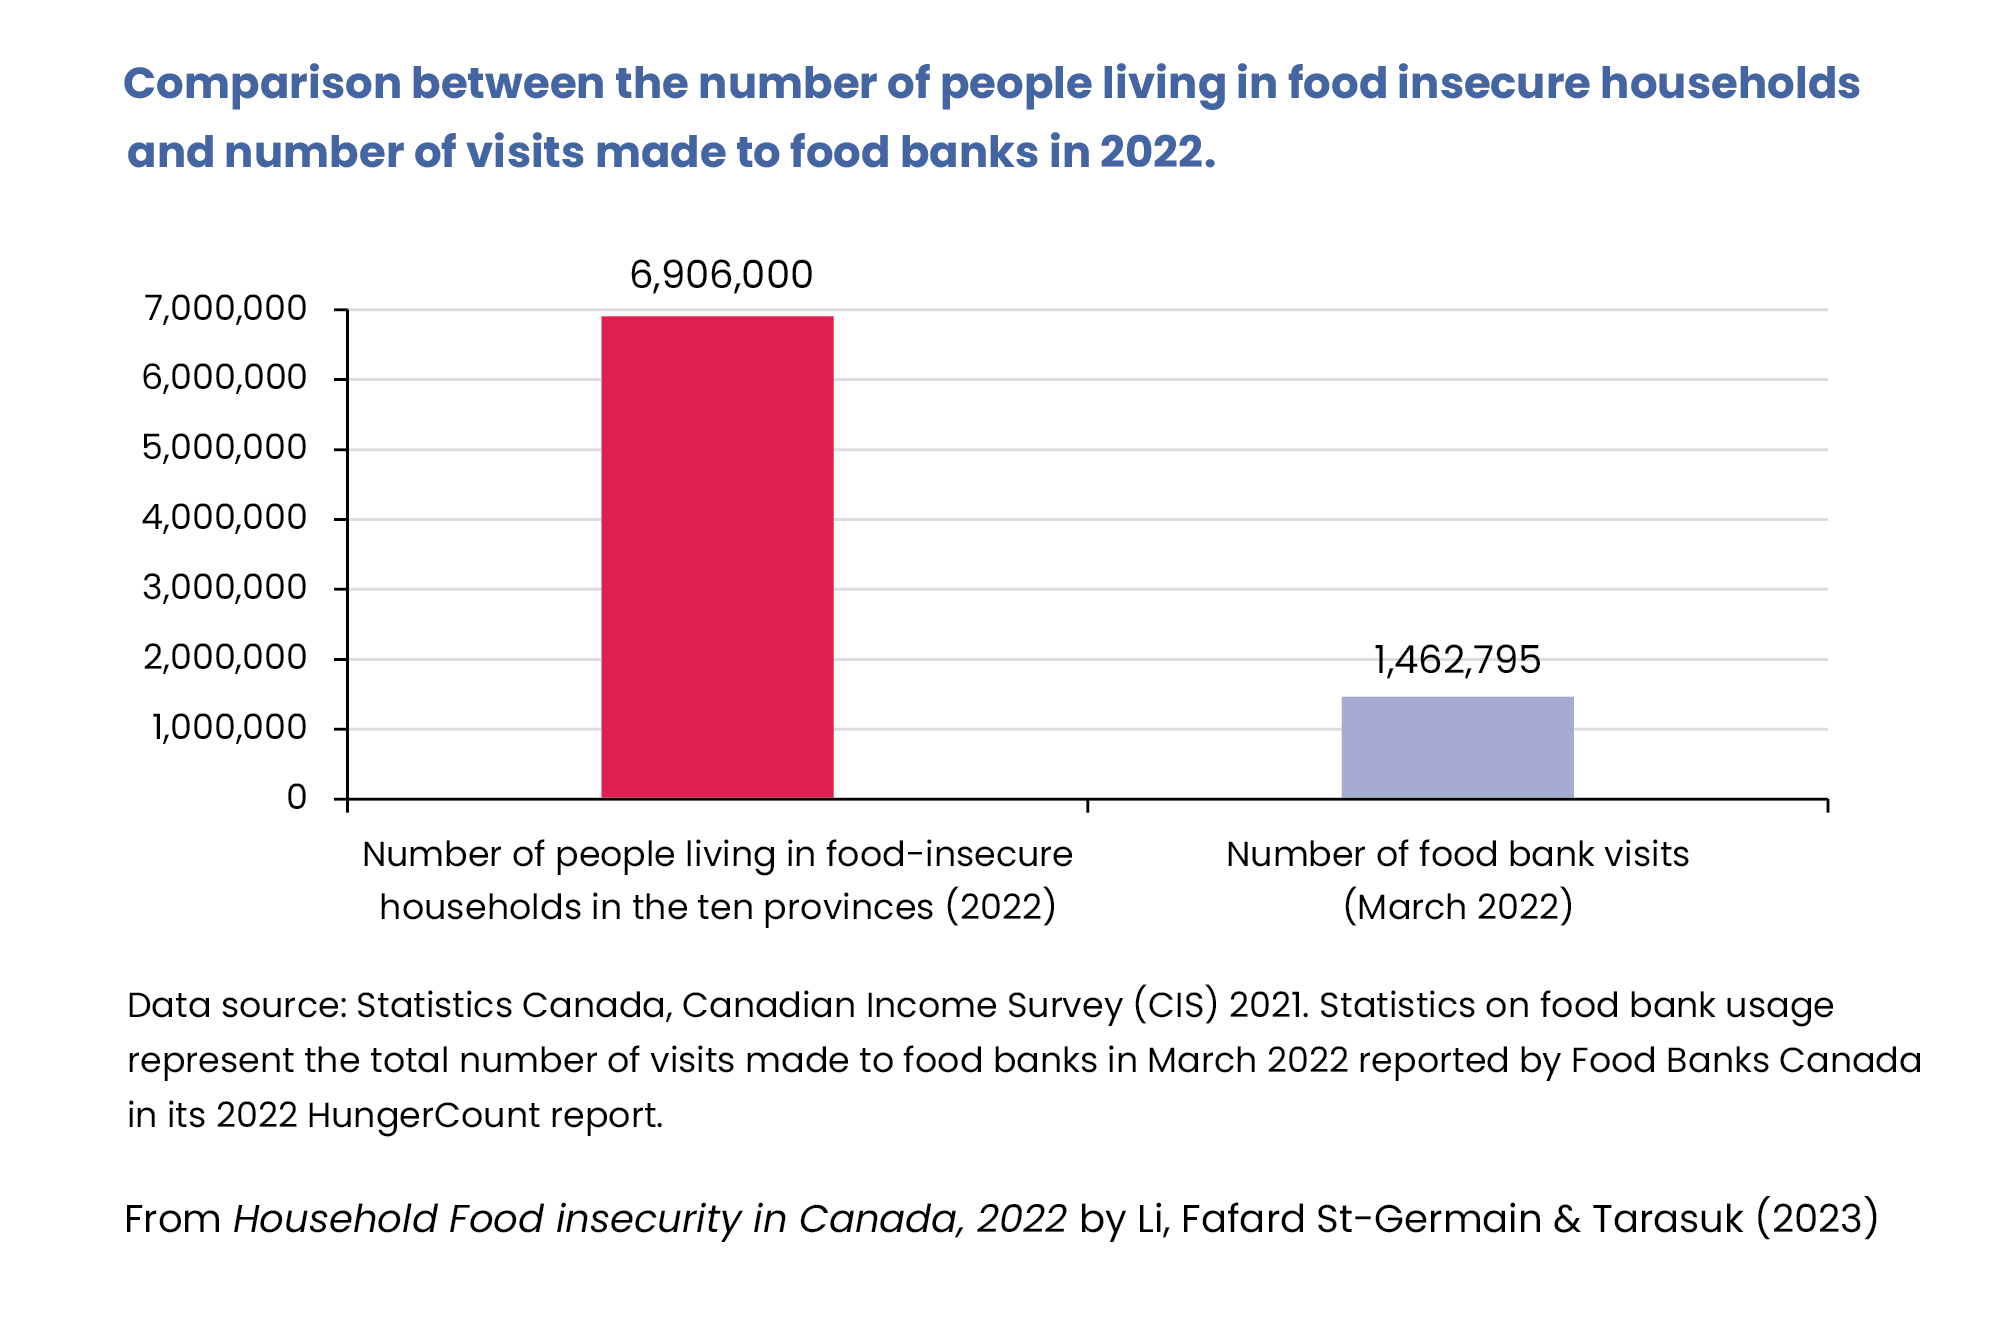
Comparing statistics on food insecurity and food bank use
Prior to food insecurity monitoring, food bank usage data was the primary reference point for problems of hunger in Canada. Measuring food insecurity through the HFSSM has provided a direct measure of household food insecurity and a way to accurately assess the scale of the problem, considering that not all individuals who experience food insecurity use food banks.
In fact, the number of Canadians living in food-insecure households is much larger than what is captured by food bank usage and research has shown that using food banks is seen as a measure of last resort that only some people take.[7]
Having accurate information on how many people experience food insecurity and why is critical for policy makers, public health planners, and advocacy groups to take action.
That’s why PROOF has published status reports to make the data from this monitoring more accessible. See our latest report, Household Food Insecurity in Canada, 2022, for more statistics and information on household food insecurity monitoring in Canada.
References
- Li T, Fafard St-Germain AA, Tarasuk V. Household Food Insecurity in Canada, 2022. Toronto: Research to identify policy options to reduce food insecurity (PROOF); 2022. https://proof.utoronto.ca/resource/household-food-insecurity-in-canada-2022/
- Statistics Canada. Canadian Income Survey: Territorial estimates, 2021. Statistics Canada; 2022. https://www150.statcan.gc.ca/n1/daily-quotidien/230621/dq230621c-eng.htm
- Fafard St-Germain AA, Tarasuk V. Prioritization of the essentials in the spending patterns of Canadian households experiencing food insecurity. Public Health Nutrition. 2018;21(11):2065-78. https://doi.org/10.1017/S1368980018000472
- Fafard St-Germain AA, Tarasuk V. Homeownership status and risk of food insecurity: examining the role of housing debt, housing expenditure and housing asset using a cross-sectional population-based survey of Canadian households. International Journal for Equity in Health. 2020;19(5):1-12. https://doi.org/10.1186/s12939-019-1114-z
- Men F, Gundersen C, Urquia ML, et al. Prescription medication nonadherence associated with food insecurity: a population-based cross-sectional study. CMAJ Open. 2019;7(3):E590-E7. https://doi.org/10.9778/cmajo.20190075
- Statistics Canada. Canada’s Official Poverty Dashboard of Indicators: Trends, March 2022. 2022. [updated 2022-03-23]. Available from: https://www150.statcan.gc.ca/n1/pub/11-627-m/11-627-m2022011-eng.htm.
- Tarasuk V, Fafard St-Germain AA, Loopstra R. The relationship between food banks and food insecurity: insights from Canada. Voluntas: International Journal of Voluntary and Nonprofit Organizations. 2019;31(5):841-52. https://doi.org/10.1007/s11266-019-00092-w
