Household Food Insecurity in Canada, 2015-16 – Graphic Series
December 28, 2018
Due to a 2015 redesign of the Canadian Community Health Survey (CCHS) that this report is based on, Statistics Canada cautions users against comparing estimates from CCHS from 2015 onwards to those prior to 2015.
Last updated: July 2019
Due to the special circumstances of the 2015-2016 Canadian Community Health Survey (CCHS), we have provided a graphical summary of key prevalence estimates, instead of a full report.
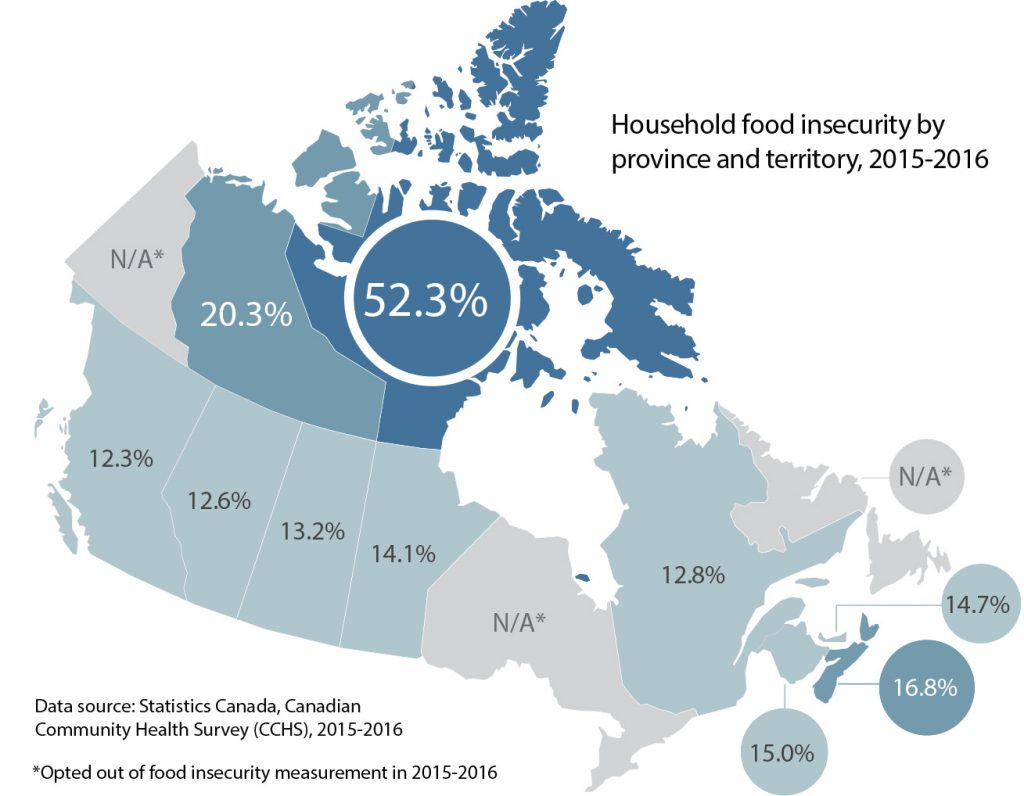
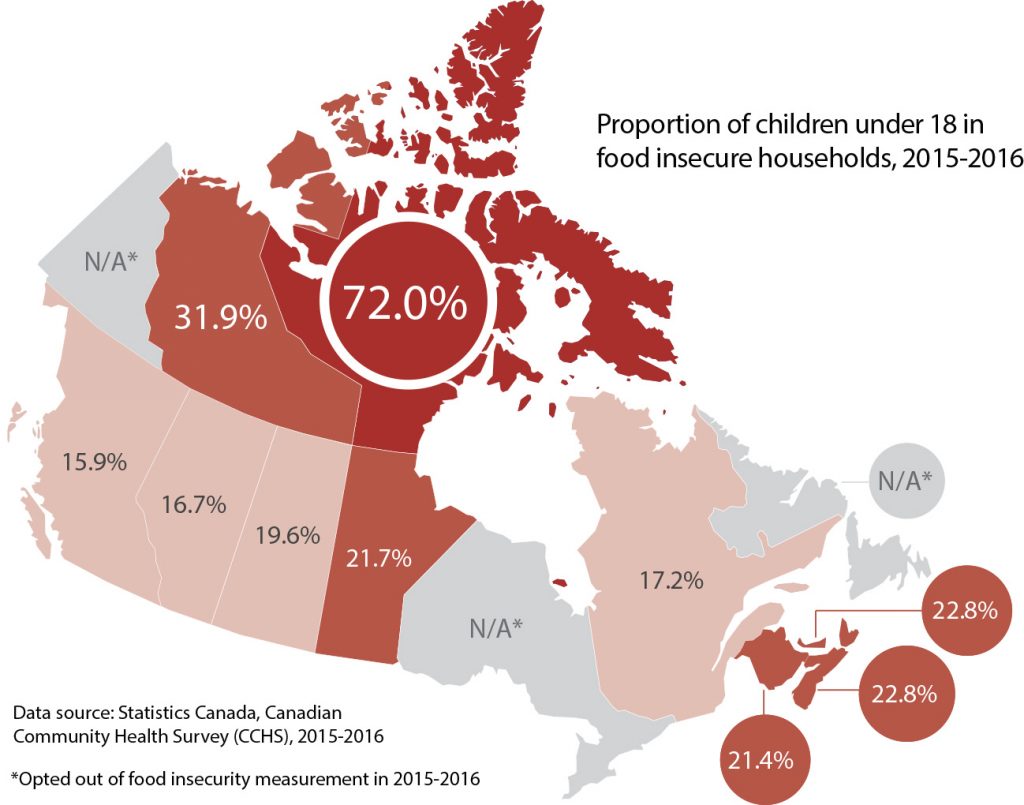
These results indicate the extent of food insecurity in 2015-2016 in the provinces and territories that elected to measure food insecurity then. In these results, we have corrected a Statistics Canada coding error that impacted the results in our earlier release of data from the 2015-2016 CCHS.
In 2015 and 2016, Ontario, Newfoundland and Labrador, and Yukon chose not to monitor food insecurity. The next national estimate will be available in the 2017-2018 cycle of the CCHS.
This cycle of the CCHS was the first to use a new research design that updated the way Statistics Canada selects households to participate in the survey. This change ensures better representation of the population, especially in smaller places, but it also means that these estimates cannot be compared to previous years.
Newfoundland and Labrador, Ontario, and Yukon opted out of food insecurity measurement in 2015-2016, but for the provinces and territories with measurements, this survey sets a new baseline by which to monitor household food insecurity in years to come.
Household food insecurity by province and territory, 2015-2016

Proportion of children under 18 in food insecure households, 2015-2016


The PROOF status reports are protected under a Creative Commons Attribution-NonCommercial 4.0 International License that allows you to share, copy, distribute, and transmit the work for non-commercial purposes, provided you attribute it appropriately to the original source. Please see Licensing & Attribution for more information.

