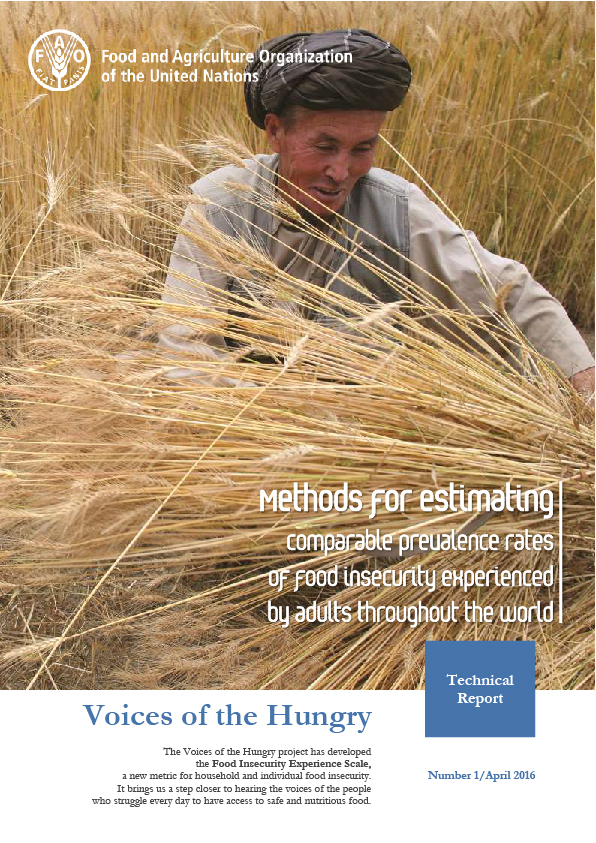
The United Nations Food and Agriculture Organization (FAO) recently released food insecurity rates for 146 countries as part of their Voices of the Hungry project. The data were collected through the inclusion of their new Food Insecurity Experience Scale (FIES) survey on the 2014 Gallup World Poll, producing the first set of comparable, nationally representative data on food insecurity around the world. The FAO estimate puts the prevalence of food insecurity in Canada at 8.0% in 2014. For other high-income countries like the United States, the UK, Australia, France, Germany, and Sweden, the rates were 10.2%, 10.1%, 10.6%, 6.9%, 4.3%, and 3.1% respectively.

While the FAO estimates provide valuable insight into how the prevalence of food insecurity differs across countries, there are some important differences between the FAO’s estimate of food insecurity in Canada and the estimates that PROOF has been reporting, drawing on data from Statistics Canada’s Canadian Community Health Survey (CCHS).
Statistics Canada has been monitoring food insecurity since 2005 through the Household Food Security Survey Module (HFSSM). It is administered on the CCHS, which surveys a nationally-representative sample of about 60,000 individuals each year.
Whereas the Gallup World Poll collected data on food insecurity in high income countries like Canada using phone interviews with samples of approximately 1000 individuals selected from random digit dialing or national lists, Statistics Canada uses the more complex method of multi-stage probability sampling to create a sample representative at the provincial, territorial, and national levels.
The large, population-representative samples in CCHS provide reliable annual data on food insecurity in Canada. The data has enabled researchers to chart changes in rates over time, identify population subgroups at particular risk of food insecurity, and examine the underlying causes and health implications of household food insecurity.
The HFSSM consists of 18 questions on experiences of food insecurity in a household over the previous 12 months, ranging from worrying about running out of food to going whole days without eating. These questions distinguish between the experiences of adults and those of children. Depending on the number of affirmative responses, households are classified as food secure or marginally, moderately, or severely food insecure.
The FIES has 8 similar questions, but in order for it to be included on the 2014 Gallup World Poll, the questions referred specifically to the individual respondent’s experience of food insecurity over the previous 12 months, and only adults were surveyed. So, the FAO’s estimates of food insecurity are based solely on data about adults’ experiences.
Although the determination of food insecurity, whether assessed using the FIES and HFSSM, is based on the number of affirmative responses, calculation of the food insecurity prevalence rates that appear in the FAO report was more complicated. Rather than applying a discrete classification scheme for food security based on raw scores from the survey, the analysts calibrated individual measures to a global reference scale to allow for comparisons between countries. The FAO prevalence estimates are roughly comparable to the prevalence of moderate and severe food insecurity as these terms have been defined by Health Canada, but they are by no means identical.
The food insecurity prevalence estimate presented for Canada in the Voices of the Hungry report cannot be compared to the estimates in our report, Household Food Insecurity in Canada, 2014, because we do not have national data on food insecurity for 2014 in CCHS.
The HFSSM was not mandatory in 2013 and 2014, and Yukon, British Columbia, Manitoba, and Newfoundland and Labrador chose not to measure food insecurity those years. The most recent national estimate derived from CCHS data is from 2012 when 8.6% of Canadian households were moderately or severely food insecure. However, a more comprehensive estimate of household food insecurity in Canada for 2012 is the national prevalence of 12.6%, which includes marginally food insecure households.
In sum, while the FAO’s Voices of the Hungry project is a valuable first step in generating information on food insecurity across a broad spectrum of countries that do not routinely monitor this problem, the estimate of food insecurity for Canada that comes from this survey should not be considered interchangeable with the estimates PROOF is deriving from CCHS data. The food insecurity estimates from CCHS are based on much larger, more representative samples, using a more comprehensive assessment of food insecurity in the household.
Moreover, with CCHS, we are able to assess not only the prevalence of moderate and severe food insecurity in Canada, but also the prevalence of marginal food insecurity. This is important given research demonstrating the increased vulnerability of people in marginally food insecure households to poor health. Thus while the FAO results provide a snapshot of where Canada sits in relation to other high income countries, the food insecurity data from CCHS are much better suited to ongoing monitoring and research to understand the causes and consequences of food insecurity in Canada.
More information:
